In “HIST 3001–Public History,” Associate Professor Tracey Deutsch and post-doctoral associate Andre Kobayashi Deckrow helped undergraduate students team up with the Mapping Prejudice Project to digitize mapping data from Minnesotan history.
Mapping Prejudice began at the U of M Libraries in 2016 when project director Kirsten Delegard and cofounders Penny Petersen, Ryan Mattke, and Kevin Ehrman-Solberg had the idea to map out racial covenants in Minneapolis. These covenants were clauses in property records that prevented non-white people from being able to purchase or occupy land. The team created a digital platform that brought on volunteers from the community to search through decades of public records in multiple counties.
Students in the HIST 3001 course continued to advance that work, scouring through hundreds of addresses from Library of Congress archives of members of the National Association for the Advancement of Colored People (NAACP). They then mapped those addresses to form a tangible picture of how events like highway construction and racialized policies displaced marginalized groups of people.
“These undergrads are really on the cutting edge in terms of creating a resource [that] can be used for all kinds of people who want to understand the history of civil rights and Minnesota,” says Delegard.
The scope of Mapping Prejudice has grown significantly since its beginnings, extending beyond Hennepin County to other areas in and around Minnesota.
“I think it's really a testament to how much work the Mapping Prejudice Project does,” says Deckrow. “They've done such a good job with looking at housing covenants, and now they're starting to look at other ways that other types of data can address inequality and issues of racial justice as well.”
Students in the course worked with Mapping Prejudice for half a semester to compile their own data. They teamed up with a member of Mapping Prejudice to input hundreds of addresses of NAACP members into a dataset that would be used to create a story map—a digital tool linked to ArcGIS that integrates history with geography.
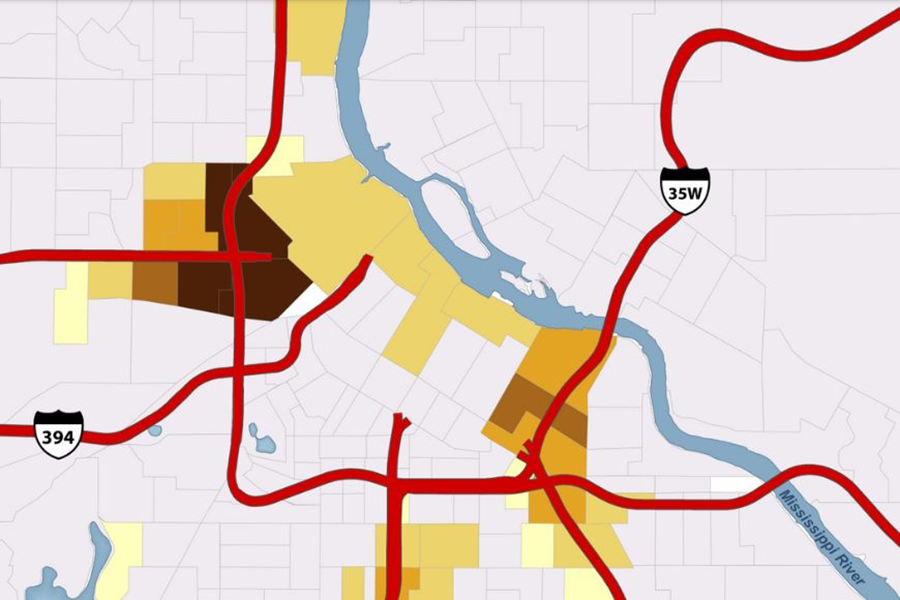
These maps show where members are and how they moved through time, along with historical research to explain the data. Students focused on Twin Cities freeway construction in the 1950s and '60s, using map data to get a clearer view on how populations changed during the building of the freeways.
“We were trying to see what effect highway construction had on Black activism in the Twin Cities throughout the 20th century using NAACP membership as a kind of proxy,” says student Alan Crenshaw. “I-35W and I-94 really decimated some areas that were key to the civil rights struggles in the Twin Cities, and it’s hard not to think that this was intentional.”
Having visual data can go a long way in revealing the bigger picture.
“[Maps] excel at conveying complex information and narratives in digestible ways,” says Crenshaw. “It’s much more visceral to know a place and see it represented in a new way.”
Deckrow agrees. “Data is essential and can help projects be very persuasive. To the untrained eye, these just look like a list of addresses and names, but when you put all of these things together, it can tell a powerful story.”
This story was adapted from the College of Liberal Arts. See the original version of the story.
- Categories:
- Arts and Humanities
- History


